Reports
Reports is the CRM in aggregate. Open it from the CRM's section rail or at
…/hosts/{site}/crm/reports. Every figure on the page is computed over the
same records the other sections list — a report can never count a contact,
deal or task the reader could not open — and most of them are counted by the
database rather than downloaded, so the page stays quick on a large CRM.
Choosing a period
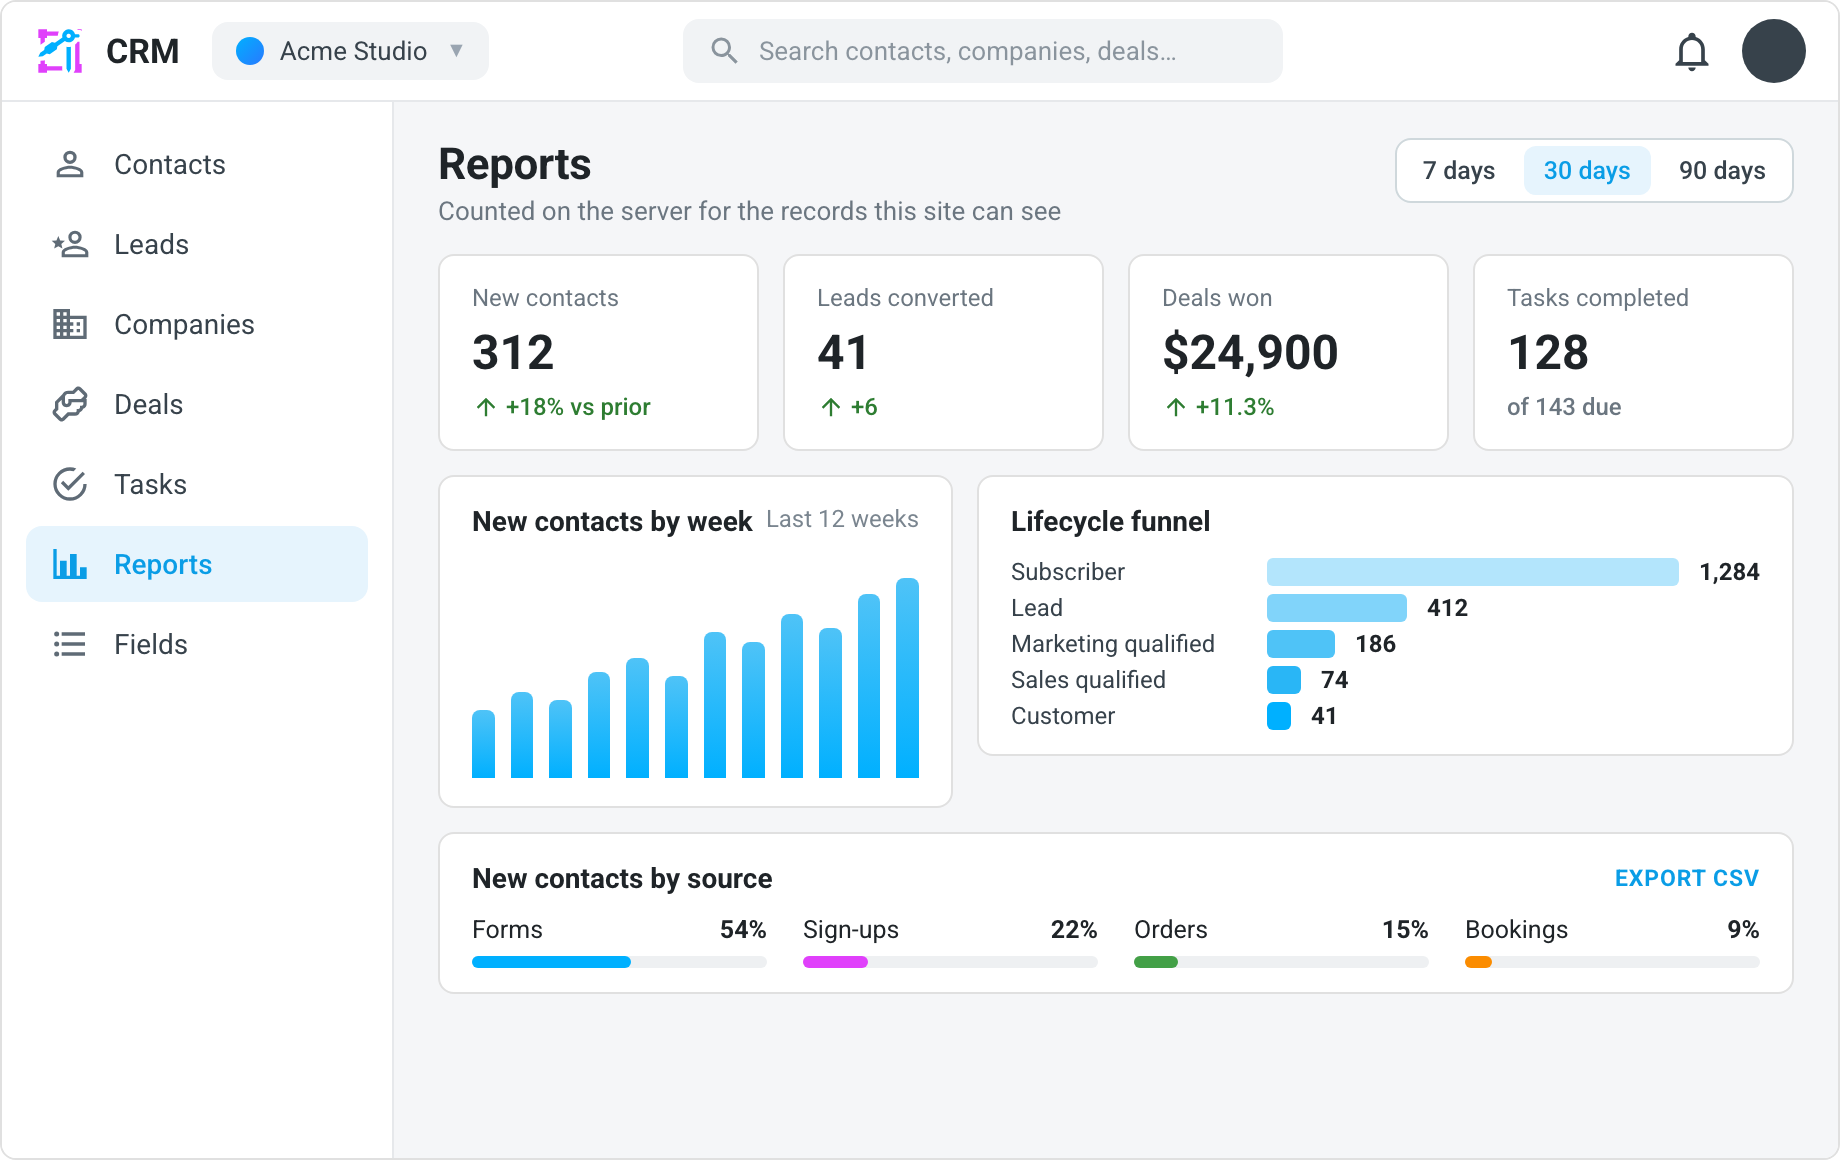
A picker at the top of the page selects the window the flow reports measure: Last 7 days, Last 30 days (the default), Last 90 days or This month. A day period counts back from the moment you pick it; "This month" starts on the first of your calendar month. Each period is compared to the one before it of the same length — thirty days against the thirty before them, this month against last month — which is what the percentage next to a figure is measured against.
Three cards ignore the period on purpose. The Pipeline, Forecast by close month and Tasks cards describe what is open now; "the pipeline over the last 30 days" would be a different question.
Every card with a table carries an Export CSV button — see Exporting a table.
Contacts
- New contacts in the period, with the change against the previous period. The percentage is left off when the previous period had nothing — a first contact has no growth rate.
- Total contacts visible to this site.
- New contacts per week — one bar per seven days from the start of the period; the last bar may be shorter.
A contact is "new" on the day it was first captured, not the day it was last edited.
Sources and lifecycle
- By source — how many contacts came through each capture surface (forms, orders, bookings, members, and so on). A person captured two ways counts under both.
- Lifecycle funnel — one row per lifecycle stage. Each row counts everyone who reached that stage or went further, so a customer also counts as a lead, and the funnel narrows as it goes down. Beside each row is how many people sit at exactly that stage now and the conversion from the step before. Contacts with no stage, and those marked Other, are reported under the funnel rather than folded into a step.
These two charts need a field off each contact, which the database cannot aggregate, so they are read from the newest 1,000 contacts your site can see. When the CRM holds more than that, the card says so and calls the figures a sample.
Conversion by source
Of the people each capture surface brought in during the period, how many are customers now.
- Captured — contacts first captured in the period, counted on the server.
- Now customers — of those, the ones who have bought: their lifecycle stage is Customer or Evangelist, or they have at least one order on the books whatever the stage says. A contact marked Other is not counted as a customer, because the report cannot know whether that stage is past a purchase.
- Conversion — customers over everyone captured.
- By source — one row per capture surface with its captured count, its customers and its conversion rate, most captured first. A person captured two ways counts under both sources, so the rows can add to more than the tile; the tile counts each person once. Contacts with no source on your site are counted in the tiles and left out of the table.
This is a cohort: the people captured in the period, followed to where they stand today. A lead captured on the first day who bought three weeks later is a conversion that source earned; a long-standing customer who bought again this month is not evidence about this period's sources. The table is read from the period's newest 1,000 contacts, through your site's own view of each person, and says so when the period held more.
Lead funnel
Of the leads this site captured in the period, where each one stands now, and why the ones closed without converting were closed.
- Leads captured — leads first seen in the period, counted on the server, with the change against the previous period.
- Qualified and Unqualified — how many of those captured have been converted, or closed without converting, each with its share of the leads captured.
- Still open — leads that are New or Working.
- Where they stand — one bar per status. A lead nobody has touched yet is New.
- Why leads were unqualified — the reasons given when leads were unqualified, most common first, each with its share of the unqualified leads. Different spellings of one reason are counted together; a lead closed with no reason is listed as No reason given.
A lead is placed by when it was first seen, so a returning visitor's second form does not make a second lead in a second period. The funnel is read from the period's 200 most recently captured leads — the same window the Leads list shows — and says so when the period held more. Because leads belong to a site rather than to the workspace, this card reports the site you are looking at; at the organization level it reads every site — at most 200 leads per site — and totals them, naming the per-site window when any site held more.
Pipeline
- Open deals and their pipeline value — the face value of every open deal, counted on the server.
- Weighted forecast — each open deal at the odds of its stage (a deal in a 60% stage counts 60% of its amount). Won and lost deals are never in the pipeline: a won deal is revenue and a lost one is history.
- Deals by stage, per pipeline, each stage with its count, value and weighted value. A deal sitting in a stage the pipeline no longer has, or in no pipeline at all, is listed separately and is worth nothing to the forecast.
- Top open deals — the ten largest, each a link to the deal.
Deals in more than one currency are added as numbers and shown in the most common currency, with a note saying so.
Forecast by close month
Every open deal, laid out by the month it is expected to close — one row per month for the next six, starting with the current month — and one column per pipeline, with a column for all of them together when there is more than one. Each cell shows the deals' face value, their weighted value (each at the odds of its stage) and how many there are.
Three rows sit beside the months so the column adds up to the open pipeline:
- No expected close — open deals with no close date. Their own row on purpose: it is the size of the pipeline nobody has scheduled, which is usually the number worth acting on.
- Before this month — deals whose expected close has passed. Shown only when there are any.
- Later — deals expected past the sixth month. Shown only when there are any.
The last row is the whole open pipeline per column. Months are your calendar months, and a deal dated the first of a month belongs to that month. Won and lost deals are never forecast. The card reads the same window of open deals the Pipeline card reads — the 1,000 most recently updated — and says so when the window was full.
Won and lost
- Won in the period, with the value of what was won.
- Lost in the period.
- Win rate — won over everything that closed in the period.
- Won vs lost per week — two bars per week, placed by the moment each deal was closed.
Activity by teammate
Who did what in the period, busiest first.
- Activities logged — every call, email, meeting, note and other activity logged in the period, counted on the server, with the change against the previous period.
- Tasks completed — tasks ticked off in the period, counted on the server.
- Teammates active — how many people logged or completed something.
- Who did what — one row per teammate: their calls, emails, meetings, notes and other activities, the total, and the tasks they completed. A task is credited to whoever completed it, or to its assignee when the completer was not recorded. Activities an automation logged, and tasks completed with nobody assigned, share one row called No teammate.
Teammates are named from the workspace roster when it knows them, and otherwise by the name each activity was signed with, so a former member's work still reads under their name. The table is grouped from the period's 1,000 most recent activities and 1,000 most recently completed tasks and says so when the period held more; the tiles are always the server's count.
Tasks
- Open tasks, Overdue (due before today) and Due today. Today and overdue are decided on your calendar day, the same way the Tasks list decides them, so the two never disagree about the same task.
- Open tasks by assignee — for each person, their overdue, due-today, upcoming and undated tasks, and the open total. Unassigned tasks are their own row.
Exporting a table
Every card with a table — activity by teammate, conversion by source, the lead funnel, open tasks by assignee and the top open deals — has an Export CSV button beneath the table. The file holds exactly the rows on screen, in the same order with the same names and counts, so you can check it against the page; it is written in your browser from what the card has already read and costs no further reads.
Because the file is the loaded window, it has the window's limits: when a
card is grouped from a bounded read — the 1,000 most recent activities, say —
the caption beside the button says so, and the file holds the rows grouped
from that window rather than from every record. The tiles above the table
remain the server's count. Files are named for the card and the period,
such as crm-activity-30d.csv; the two cards that have no period name none.
CRM at a glance
The site dashboard carries a CRM at a glance card with five numbers: contacts, new contacts this week, the value of every open deal, tasks due today or overdue, and leads to work — the leads on this site that are still new or being worked. Each is a link into the section that explains it, and each is a single server-side count or sum — the card never downloads records to count them. Switch it off from the dashboard's customize dialog if you do not want it there.
The organization's Sites page (Organization → Sites) carries the same card above the site grid, for an organization owner, admin or editor. There every figure totals the whole organization — the leads figure is the open leads on every site, added up — and each link opens the matching section of the organization-level hub. That row is not customizable: the customize dialog belongs to a site's dashboard, and an arrangement made there does not reach the organization's page.
How the numbers are counted
- A figure that has not arrived, or that the database refused, shows as a dash — never as a zero. A zero is a measurement; a dash is the absence of one.
- Counts and sums are taken by the database. Where a chart needs a field off each record — a lifecycle stage, an assignee, the stage a deal sits in, its expected close, who logged an activity — it reads a bounded window (the newest 1,000 contacts, the period's newest 1,000 contacts, the 1,000 most recently updated open deals, the 1,000 soonest-due open tasks, the 500 most recently closed deals of each outcome, the period's 1,000 most recent activities and 1,000 most recently completed tasks, the period's 200 most recently captured leads) and says when the window was full. Two cards that need the same window share one read.
- Everything follows the same per-site visibility as the contacts themselves. A collaborator scoped to one site sees that site's totals, not the organization's.
- The figures are remembered for a minute. Leaving the section to open a deal it named and coming straight back costs no reads and shows the same numbers; Refresh asks the database again at once, and a different period or a different site is always its own read.
Related
- CRM overview
- Deals pipeline — the stages and probabilities the pipeline and forecast figures read
- Tasks & follow-ups — the views the task counts mirror
- Leads — the statuses and reasons the lead funnel counts
- Activities — what the activity leaderboard counts
- The contact record — the lifecycle stages the funnel is built from